Showing posts with label geography. Show all posts

Thursday, August 29, 2013

Mapping Canada’s Mineral Resources

With Beautiful Landscapes & Wall Maps of Canada

Lake Louis, Alberta, Canada from Piriya Photo


Geo-Mapping is the Key to Mineral Opportunities in Canada's North
GEM is the Geo-mapping for Energy and Minerals program, recentlyrefunded to facilitate exploration activities in Canada’s North.

Why are Mineral Resources so Important?
Canada’s mineral resources include gold, diamonds, copper, zinc and lead among others. The mining sector is proportionally the largest private sector employer of Aboriginal peoples in Canada, and employment is poised to increase (Exploration and Mining Guide toAboriginal Communities).

Canada Physical Wall Map
This Canada Physical Wall Map features lakes, rivers, mountain ranges with a range of colors. 
Mapping Canada’s Mineral Resources
Canada is the number 1 destination for mineral exploration on the planet since 2006. Like Canada’s neighbor, Alaska (which we explored in Alaska's Frontiers: Mapping Strategies for Mineral Resources), Canada is abundant in mineral resources, but largely unmapped. Mapping these key resources will show the best locations for mining and minimize environmental impact.

1978 Vintage Canada Wall Map
British ColumbiaAlberta and Yukon Wall Map 1978 Wall Map
The Future: Looking at the Past on Wall Maps of Canada
National Geographic’s 1978 take on Canada as “Beauty to Flaunt and Bounty to Grown On” on this vintage Canada Wall Map shows that the vast resources of Canada were enviable several decades ago as well. As time goes on and development continues, unexplored areas become more desirable and even more important for further development.

Pingualuit Crater, Northern Canada

Wednesday, July 31, 2013

Why Is North Up on Maps? Upside Down Maps Break Conventional Perspective

Why Is North Up on Maps?

We see it everyday, even on google maps: North is at the top, up, above on most 2-dimensional depictions of the world. But why is north up on maps so often that countries become unrecognizable when show 'upside down'?

Maps Throughout History

Throughout history, the orientation of maps has actually changed more than you might have assumed. In medieval Europe during the crusades, Jerusalem was positioned at the top of the map, putting East at the top. This alignment to where the sun rose helped give us the word ‘orient’.

Arabic maps placed south at the top. Possibly because when one wakes up to face the sun, south is on the right (right having a positive connotation).

In the west, the tradition of orienting maps to the north began with the 5th century Alexandrian geographer Claudius Ptolemy. Ptolemy’s work, the Geographica, is considered the first known geography. Ptolemy was familiar with Polaris, the North Star, and in order to encapsulate his known world and celestial space, he chose to make north up on maps.

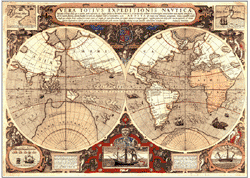
antique world map explorers

North-South Up-Down Concept Affects Perceptions

Similarly, as explorers continued on the quest to map the world in later centuries it was easier to start a map at the top, with the area explorers were most familiar with: the Northern hemisphere. Writing location names and notes in this orientation discouraged the turning or rotation of maps so north remained up on maps.

The orientation of maps is reflective of and has an effect on our perception of the world. We often think of space in the form of ‘above’ and ‘below’ according to the North is Up perspective on most modern maps. That city is ‘below the river’. The United States is ‘above Mexico’ and ‘below Canada’. Australia is known as the ‘land down under’. Although literally ground is below and sky is above nearly any given location, because maps have taught us that north is up and south is down, we talk about places in this way.


View The World From a Different Perspective on Upside Down Maps

Upside down maps force us to view the world differently. When we see south at the top of the map and north at the bottom, we may notice new things about the world. For instance, on an upside down map it is easier to notice:
  • most of the land mass of the world is concentrated in the northern hemispheres
  • South America is more south-east than directly south of North America
  • Europe appears less significant ‘below’ the large continent Africa
If you read this entire article you must have liked it. Please share using one of the buttons below, thanks!

Thursday, July 25, 2013

Master List of Map and Geography Jokes!

mapsales.com has searched the web far and wide for the best map jokes. We’ve included funny geography jokes and travel jokes as well. Whether you are taking a family trip or teaching students about geography, map jokes can break the ice and get children and adults conversing about places around the world, geography and maps!

Enjoy these funny map jokes!

Q. What do John Wayne and a map key have in common?
A. Both are legends.

Q. Why do paper maps never win at poker?
A. Because they always fold.

Q. What did the mapmaker send his sweetheart on Valentine’s Day?
A. A dozen compass roses.

Q: What always sits in the corner but can move all round the world?
A: A stamp!

Q: Why is it easy to get into Florida?
A: Because there are so many keys.

Q: What is round at each end and high in the middle?
A: Ohio.


Q: What did the sea say to the shore?
A: Nothing, it just waved!

Q: What do fish and maps have in common?
A: They both have scales!

Q: What kind of maps do spiders make?
A: Web-based maps!

Q. What is smarter, longitude or latitude?
A. Longitude, because it has 360 degrees

Q. Why does west longitude need to be cheered up?
A. Because it is always negative.

Q. What map element plays in the band?
A. The symbols (cymbals).

Q: What’s a map favorite type of syrup?
A: Map-le syrup!

Q: Where do fish keep their money?
A: In riverbanks.

Q: Where is it always 90 degrees, but never hot?
A: The North and South Poles.

Q: What do you get if you cross a farm animal with a map maker?
A: A cow-tographer!


Q: What rock group has four men that don't sing?
A: Mount Rushmore!

Q: What would you get if you crossed a river and a desert?
A: Wet and thirsty.

Q: Who is the coldest relative on earth?
A: Aunt Arctica.

Q: What's the coldest city in Germany?
A: Brrr lin (Berlin).

Q: Where can you find lots of shoes?
A: In the foothills!

If you liked these map jokes, share them with your friends!

Friday, April 26, 2013

The Oddest, Most Bizarre Maps


"Mapping our world" can mean a multitude of things. From our first map of a schoolyard or home, to maps of our favorite places to dine, maps of places we've traveled, maps play different roles in our lives, from the classroom, in our minds, in vacations and to artwork. Take a look at a few of these strangely bizarre maps. They'd make great decor and conversation starters at least!

Click on the pictures to zoom in on any wall map; take a detailed look at the world from an unusual perspective!

Titanic Navigation Chart Wall Map
Chart the the path the largest ship of it's time took across the Atlantic Ocean! Marine Charts are usually coveted by a very specific set of people, but the legacy and myth surrounding the story of the Titanic's maiden and final voyage makes this an usually popular map!

Titanic Navigation Chart Wall Map


Muir Glacier Alaska Wall Map
Artistic and minimalist, this map of Alaska shows the Muir Glacier in Glacier Bay National Park. The challenge of mapping a glacier make this bizarre map a work of art.

Muir Glacier Map in Alaska


Upside Down World Wall Map
View the world from a different perspective with this Upside Down World map. After all, there is no "UP" in outer space! This bizarre map shows us how the image of the world "right-side up" is imprinted and ingrained into our minds.

Upside Down Wall Map


Mars Physical Wall Map
We've barely started exploring space but we can already map out our sister planet Mars. This odd map shows more than it appears to at first glance, just zoom in to see!

Wall Map of the Planet Mars


Friday, April 5, 2013

New Baseball Map - Track Your Favorite Teams this Season

Baseball season has begun! Track your favorite teams this season with mapsales.com’s comprehensive Baseball Map. This wall map compliments collections of baseball memorabilia, brings a favorite sport to offices in a professional display and encourages children’s interest in Little League. The new baseball map from publisher MarketMAPS shows the city stadium locations of 303 teams from 26 Major, Minor and Independent Leagues across the US and Canada.

baseball map


Explore Favorite Teams and Discover New Favorites
Marvel at the sheer amount of teams and stadiums across the US and Canada. Find your favorite team on the wall map and learn about lesser known teams, spring training leagues and baseball popularity in any area. Track their travel as favorite teams play at different stadiums throughout the season. This comprehensive wall map includes team classes, baseball symbols for league types, city sizes, state boundaries, and major highways. 24 smaller maps showcase each league and the locations of their teams’ stadiums.

baseball map

Decorate with A Baseball Wall Map
This baseball map comes in a range of sizes, starting at 3x3 feet, perfect for any wall. The wall map’s color scheme embraces the green of the field balanced with sophisticated warm tones. mapsales.com recommends an executive frame for this wall map for professional and decorative display!

Tuesday, March 5, 2013

Congo Map: Thousands Flee Fighting in East Congo

Mapsales examines these Congo maps as thousands flee their homes. The fighting in east Democratic Republic of Congo between rebels and government forces continues today, despite an overwhelming death toll.

Death Toll at 70, Possibly More

The fighting began last week in the town of Kitchanga, which is in Nord-Kivu, found on this Democratic Republic of Congo Map. The Democratic Republic of Congo is the second largest country in Africa by area. The Democratic Republic of Congo features a variety of geographic features including mountains, the Congo River, rain forest and savannas.

Congo Map: Democratic Republic of Congo Physical Wall Map
Map of the Democratic Republic of Congo
The rivers and mountains are seen on this physical Democratic Republic of Congo Map. The Albertine Rift Mountains experiences volcanic activity which has exposed an enormous amount of mineral wealth. Gold, copper, diamonds, cobalt, cadmium, silver, and coal are just a sample of the plentiful supply of minerals. However, where there is wealth, there is also conflict.


Brief History of African Conflicts 

The Second Congo War, also known as the African World War, began in 1998 and involved nine African nations and twenty armed groups. As fighting surges and decreases in neighboring countries, refugees on the losing side flee to nearby countries, sometimes restarting conflicts. Countries such as Rwanda and Uganda may sound familiar due to the amount of fighting in recent decades. Take a look at the Democratic Republic of Congo's neighboring countries on this political Africa Wall Map. Although peace treaties were signed in 2003, the fighting continues in the east. Ethnic tensions and battles over resources add to the complexity of the conflict.

Africa Wall Map - Political


Over 10,000 people have gathered in front of the UN base in Kitchanga, fleeing the fighting and torched homes. It appears that fighters on both sides of the conflict are accused of violence toward civilians, killing 5.4 million people since 1998.

Thursday, February 21, 2013

Is GIS the Future? Prepare for New Jobs with Educational Wall Maps


GIS stands for Geographical Information Systems, systems designed to capture, manipulate, and present all types of geographical data. It combines technology, geography and data in ways that are quickly changing all aspects of life and how we approach the world. But are our children prepared to become the experts in this field? mapsales.com takes a look at the future job report, GIS innovations and educational wall maps to find out.

Recently in the news, we’ve heard reports about GIS being used to help fight crime in New York, Los Angeles and now Australia. The UN recently promoted the use of GIS in disaster risk reduction, preparedness and emergency response. All of these new innovations mean that GIS is an emerging sector of the workforce.

More jobs are a good thing, right? Not if Americans are ill-equipped to fill those positions.

In this letter to Congress, a former teacher urges everyone to support the Teaching Geography is Fundamental Act. He explains that “There is an enormous demand in both the public and private sectors for people with the ability to interpret and analyze geographic data. There are 70,000 new jobs in geospatial technology each year, but we are not training Americans to fill them.”

Educational Wall Maps - World
It is important to educate young Americans in the way that will best prepare them to take over governance of the USA. This includes immersing children with educational wall maps, and encouraging them to have an opportunity to become interested in the world. Most importantly, starting to do so at a young age. Think about encouraging geographical skills that could help the world and shop by grade level for Educational Wall Maps.

Do you agree that GIS will be the way of the future? How should we prepare our children for a technological world?

Tuesday, February 19, 2013

Alaska's Frontiers: Mapping Strategies for Mineral Resources


Alaska is known as the last US frontier, this Alaska Wall Map shows the vast land rich in minerals. The most difficult part is knowing what areas are important to mine and what areas shouldn't be mined. Here’s where mapping plays a key role. State geologists are mapping the potential of geographical areas from the land and air.

Why is Alaska so geologically important?

Part of that involves being located on the edge of the Pacific crustal plate. That also means multiple volcanoes and unpredictable weather. According to geological surveys, 40 million acres of state land possess high potential for mineral deposits. Only an eighth of this land has been mapped.

Alaska Wall Map

Top resources from Alaska include gold and oil, and they account for a large amount of Alaska’s wealth. Alaska also produces zinc, silver, copper, platinum as well as sand and gravel.

But state geologists are interested in rarer minerals. The strategy is to map areas with minerals strategic for military technology and/or that we import from other countries. This list includes: platinum group antimony, barite, chromite, cobalt, fluorite, gallium, graphite, indium, platinum group elements, rare earth elements, rhenium, tantalum, titanium, tungsten, yttrium and niobium. 

Producing these minerals would make the United States less reliant on importing them from other countries, saving money on technological advances. But mining takes a toll on any environmental system. By knowing exactly where the highest concentrations of minerals are located, environmental impact could be lessened.


Is it worth mining rare minerals and harming Alaska’s ecosystems for the economic independence?

Thursday, February 14, 2013

Satellites Show Disturbing Images of North Korea


Seismic activity was detected after the blast of North Korea’s latest nuclear test. The U.S. Geological survey was able to pinpoint the location of the blast. Google maps show Nuclear Test Road, leading up a mountain and Nuclear Test Facility. The location of the blast is not far from Nuclear test Road.


As a very closed-off country, not a lot is known about North Korea from first-hand accounts. In this case, we only have satellite data about the country's recent activity. And that geographical information can reveal more than the country probably wants revealed. 

Other disturbing images of North Korea include satellite images of gulags, brutal concentration camps. North Korea has denied the existence of these camps, but the satellite images serve as compelling evidence, evidence that could prompt action to end these atrocities. 

Until then, we can only continue to improve our maps and understanding of the world. "We know this map is not perfect," Google senior product manager Jayanth Mysore said in a statement posted online, referring to the project of creating an accurate map of North Korea. "One of the exciting things about maps is that the world is a constantly changing place."

Physical Map of North Korea
View more wall maps!

Thursday, February 7, 2013

Digital Maps Versus Paper Maps


There’s a lot of media buzz recently about not only how amazing digital maps are, but also their failings. Do we rely too much on digital maps? mapsales.com takes a look at how technology has improved the usability of paper maps as well.

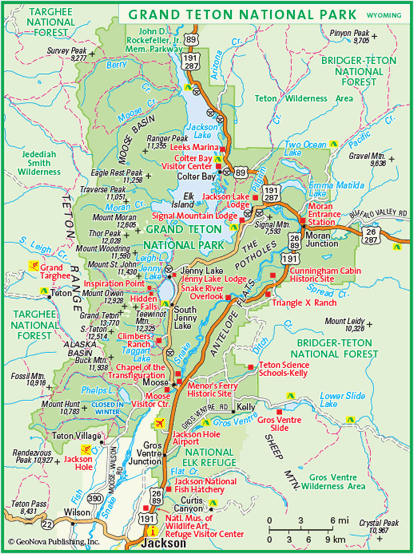
If you’re worried about bad weather affecting your paper maps while hiking or skiing, invest in synthetic paper mapsFor example, while testing out Google’s Ski Resort coverage at Jackson Hole Mountain Resort, you can also take this Grand Teton National Park Map to check out the trails, museums, and other points of interest, without worrying about wear and tear or water stains.


Today we might still recognize the motif of a man refusing to ask for directions, poring over a large paper, fold-out map. That motif may well become obsolete. Our digital devices give a (mostly) precise description of our location and (mostly) correct directions to wherever we’d like to go, even speaking the directions so we don’t have to consult the on-screen map.

However, what happens when technology fails? Apple maps are the most well-known example of this failure, leaving a group in Australian stranded in a national park 40 miles away from their destination. Smaller mistakes do occur, as well as the very real possibility of running out of battery power.

The fact that, as Christine Ortiz notes in Why Digital Maps Aren’t Ready to Replace Paper, military personnel still prefer to consult paper maps, says a lot about the benefit of keeping a paper map backup in your car or backpack. This may be especially handy in areas where satellite coverage is sparse, with maps of the rural areas or National Park Wall Maps.

Check out more wall maps at mapsales.com.


Thursday, January 31, 2013

Lights Seen from Space: Cities…and Lightning Flashes?

Severe storms have been sweeping across southern states for the last two days and are now currently spreading across eastern parts of the United States. So far the storms have included 430 thunderstorm reports, 20 large hail reports and nine tornado reports.

Last night, the Suomi NPP satellite snapped a photo of not only city lights but also lightning flashes from the storm. In this photo, the satellite captured lights from several major cities not covered by clouds including Atlanta, Georgia, Nashville, Tennessee and Chattanooga, Tennessee. Also visible are lights not associated with any city; these lights show lightning flashes from the severe storm.

Lighting Flash Captured from Severe Storm


Satellite imaging technology allows us to view the world in great detail. Satellites are able to capture daytime images  that keep our database of roads, buildings, and topography up-to-date. They also warn us of impending natural disasters, as well as perspective on the damage they caused. But at night, we get a view we could only imagine before our ascent into space:

World at Night Wall Map
Earth at Night Map

Maps of satellite images from space showcase the entire world at night. Taken from series of images from cloudless nights over a year period to show the clearest rendering of topography and lights, this map shows a unique perspective of the world. Zoom in on the Earth at Night Map to see details of the night sky from space! These lights include urban areas, forest fires and natural gas burn off. This map would make a great gift or decor piece for anyone who loves space, travel or technological art.

Friday, January 4, 2013

Oddities of the Frozen World


As much as maps can help us understand information about geography, science, and nature, there is still much about our world that remains mysterious.  mapsales.com shares some awe-inspiring oddities of the “frozen world”.


Near the planet’s poles and in other cold regions, there are unusual water formations that are sure to take your breath away. 


The unbelievably blue river in Greenland is caused by the melting Petermann Glacier.  When the glacier melts, it fills low-lying areas with beautifully blue waters.  The melting and filling patterns change from season to season in expected ways.  The Blue River is a popular destination for kayakers because of its fluctuating flows and its stunning water. 


Ice caves like this one are caused by natural processes involving glaciers, melting, and sediments.  But knowing the science behind it doesn’t take away from the ice cave’s majesty.  This particular ice cave is located in Skaftafell, Iceland.  It is a temporary structure that is only accessible through a 22-foot entrance along the shoreline. 


The frozen wave in Antarctica is a structure that needs to be seen to be believed.  Discovered in 2007, it was initially thought that a wave was flash frozen by the sub-zero temperatures and perfectly preserved.  But the presence of blue ice in the wave has led scientists to believe that the structure was actually built slowly over time. 


If you watch movies like Titanic, you may assume that all icebergs are blue or clear.  But sailing around the Southern Ocean will give you different idea.  You will find icebergs with yellow, brown, blue, and green stripes in the cold waters around Antarctica.  This phenomenon occurs when the icebergs interact with salt and fresh waters.  Lapped by the waves, and blown by the winds, icebergs can be painted with amazing stripes of different sizes and textures.


Thanks for reading this article. If you got this far, you probably liked it so please share it with your friends!

Thursday, December 27, 2012

University of California Berkley Auctions Off Historic Map Collection

Earlier this month, the geography department at UC Berkeley auctioned off its sizeable map collection.  mapsales.com takes a look at some of these historic maps. 


Although modern maps have gone the way of computerized images and digital applications, there is nothing quite like an antique map that you can hold in your hands.  Hand-drawn maps are becoming rare pieces of cartographic art.  If you were lucky enough to be in Northern California’s Berkeley area this December, you could have gotten your hands on some rare and historic maps. 

University of California Berkeley’s geography department held its map auction on December 15, selling off its historic collection of state, city, topographic, water table, and country maps.  The maps sold from 50 cents to $5. 


According to Dan Plumlee, manager of the department’s map collections, space is a big reason for the sale.  There is simply not enough room to hold the large map collection.  And while geography students as well as department faculty still use physical maps, the ones marked for sale were either redundant or rarely used. 


The biggest sellers of the day were topographic maps (maps that display elevations of a specific area).  Topographic maps are used by researchers and teachers, as well as hikers and architects. 

Want to learn more about historic and antique maps? Contact us!  mapsales.com carries over 200,000 wall maps…delivered as fast as next day!