Showing posts with label natural world. Show all posts

Thursday, August 29, 2013

Mapping Canada’s Mineral Resources

With Beautiful Landscapes & Wall Maps of Canada

Lake Louis, Alberta, Canada from Piriya Photo


Geo-Mapping is the Key to Mineral Opportunities in Canada's North
GEM is the Geo-mapping for Energy and Minerals program, recentlyrefunded to facilitate exploration activities in Canada’s North.

Why are Mineral Resources so Important?
Canada’s mineral resources include gold, diamonds, copper, zinc and lead among others. The mining sector is proportionally the largest private sector employer of Aboriginal peoples in Canada, and employment is poised to increase (Exploration and Mining Guide toAboriginal Communities).

Canada Physical Wall Map
This Canada Physical Wall Map features lakes, rivers, mountain ranges with a range of colors. 
Mapping Canada’s Mineral Resources
Canada is the number 1 destination for mineral exploration on the planet since 2006. Like Canada’s neighbor, Alaska (which we explored in Alaska's Frontiers: Mapping Strategies for Mineral Resources), Canada is abundant in mineral resources, but largely unmapped. Mapping these key resources will show the best locations for mining and minimize environmental impact.

1978 Vintage Canada Wall Map
British ColumbiaAlberta and Yukon Wall Map 1978 Wall Map
The Future: Looking at the Past on Wall Maps of Canada
National Geographic’s 1978 take on Canada as “Beauty to Flaunt and Bounty to Grown On” on this vintage Canada Wall Map shows that the vast resources of Canada were enviable several decades ago as well. As time goes on and development continues, unexplored areas become more desirable and even more important for further development.

Pingualuit Crater, Northern Canada

Friday, March 1, 2013

Hawaii Wall Map: View the Happiest State in the USA

The Hawaiians are the happiest people in the nation according to a new Gallup-Healthways poll. mapsales.com takes a look at the survey and the best Wall Maps of Hawaii.

It’s no surprise: Hawaii is a prime vacation location and Hawaii Wall Maps are popular travel keepsakes, reminding visitors of the lush greenery, beautiful beaches and surfing. Although we usually imagine only travelers having great experiences in Hawaii, apparently the residents make this the happiest state in the USA. At the bottom of the poll, West Virginia represented the lowest overall well-being among US States.

Our Favorite Hawaii Wall Map
Learn more about the happiest state in the USA with this Hawaii Wall Map. The poll used telephone interviews conducted all last year.  A total of 353,564 random American adults were polled from all across the USA, and even the District of Columbia. They measured six elements of happiness: life evaluation, emotional health, work environment, physical health, healthy behavior and basic access.

Hawaiian residents reported the highest score on life evaluation, which included self-evaluation about your present life situation and anticipated one in five years. They also scored high for emotional health: they were more likely to have smiled or laughed a lot the previous day, and the least likely to have daily worry or stress.  Although they didn't score the highest in each category, Hawaiian happiness overall makes Hawaii the happiest state in the USA.

The Happiest State: Hawaii Wall Map
Another great wall map of Hawaii, FindIt Hawaii shows all roads and topographical features, perfect for the traveler. Explore, plan and travel across the major islands: Hawaii, Maui, Oahu and Kauai with this Hawaii Wall Map. Where would you go first? Or would you prefer to live all year in Hawaii?

Tuesday, February 19, 2013

Alaska's Frontiers: Mapping Strategies for Mineral Resources


Alaska is known as the last US frontier, this Alaska Wall Map shows the vast land rich in minerals. The most difficult part is knowing what areas are important to mine and what areas shouldn't be mined. Here’s where mapping plays a key role. State geologists are mapping the potential of geographical areas from the land and air.

Why is Alaska so geologically important?

Part of that involves being located on the edge of the Pacific crustal plate. That also means multiple volcanoes and unpredictable weather. According to geological surveys, 40 million acres of state land possess high potential for mineral deposits. Only an eighth of this land has been mapped.

Alaska Wall Map

Top resources from Alaska include gold and oil, and they account for a large amount of Alaska’s wealth. Alaska also produces zinc, silver, copper, platinum as well as sand and gravel.

But state geologists are interested in rarer minerals. The strategy is to map areas with minerals strategic for military technology and/or that we import from other countries. This list includes: platinum group antimony, barite, chromite, cobalt, fluorite, gallium, graphite, indium, platinum group elements, rare earth elements, rhenium, tantalum, titanium, tungsten, yttrium and niobium. 

Producing these minerals would make the United States less reliant on importing them from other countries, saving money on technological advances. But mining takes a toll on any environmental system. By knowing exactly where the highest concentrations of minerals are located, environmental impact could be lessened.


Is it worth mining rare minerals and harming Alaska’s ecosystems for the economic independence?

Thursday, February 7, 2013

Digital Maps Versus Paper Maps


There’s a lot of media buzz recently about not only how amazing digital maps are, but also their failings. Do we rely too much on digital maps? mapsales.com takes a look at how technology has improved the usability of paper maps as well.

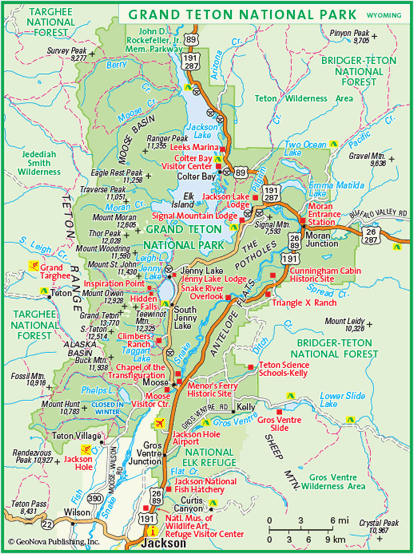
If you’re worried about bad weather affecting your paper maps while hiking or skiing, invest in synthetic paper mapsFor example, while testing out Google’s Ski Resort coverage at Jackson Hole Mountain Resort, you can also take this Grand Teton National Park Map to check out the trails, museums, and other points of interest, without worrying about wear and tear or water stains.


Today we might still recognize the motif of a man refusing to ask for directions, poring over a large paper, fold-out map. That motif may well become obsolete. Our digital devices give a (mostly) precise description of our location and (mostly) correct directions to wherever we’d like to go, even speaking the directions so we don’t have to consult the on-screen map.

However, what happens when technology fails? Apple maps are the most well-known example of this failure, leaving a group in Australian stranded in a national park 40 miles away from their destination. Smaller mistakes do occur, as well as the very real possibility of running out of battery power.

The fact that, as Christine Ortiz notes in Why Digital Maps Aren’t Ready to Replace Paper, military personnel still prefer to consult paper maps, says a lot about the benefit of keeping a paper map backup in your car or backpack. This may be especially handy in areas where satellite coverage is sparse, with maps of the rural areas or National Park Wall Maps.

Check out more wall maps at mapsales.com.


Thursday, January 31, 2013

Lights Seen from Space: Cities…and Lightning Flashes?

Severe storms have been sweeping across southern states for the last two days and are now currently spreading across eastern parts of the United States. So far the storms have included 430 thunderstorm reports, 20 large hail reports and nine tornado reports.

Last night, the Suomi NPP satellite snapped a photo of not only city lights but also lightning flashes from the storm. In this photo, the satellite captured lights from several major cities not covered by clouds including Atlanta, Georgia, Nashville, Tennessee and Chattanooga, Tennessee. Also visible are lights not associated with any city; these lights show lightning flashes from the severe storm.

Lighting Flash Captured from Severe Storm


Satellite imaging technology allows us to view the world in great detail. Satellites are able to capture daytime images  that keep our database of roads, buildings, and topography up-to-date. They also warn us of impending natural disasters, as well as perspective on the damage they caused. But at night, we get a view we could only imagine before our ascent into space:

World at Night Wall Map
Earth at Night Map

Maps of satellite images from space showcase the entire world at night. Taken from series of images from cloudless nights over a year period to show the clearest rendering of topography and lights, this map shows a unique perspective of the world. Zoom in on the Earth at Night Map to see details of the night sky from space! These lights include urban areas, forest fires and natural gas burn off. This map would make a great gift or decor piece for anyone who loves space, travel or technological art.

Friday, January 4, 2013

Oddities of the Frozen World


As much as maps can help us understand information about geography, science, and nature, there is still much about our world that remains mysterious.  mapsales.com shares some awe-inspiring oddities of the “frozen world”.


Near the planet’s poles and in other cold regions, there are unusual water formations that are sure to take your breath away. 


The unbelievably blue river in Greenland is caused by the melting Petermann Glacier.  When the glacier melts, it fills low-lying areas with beautifully blue waters.  The melting and filling patterns change from season to season in expected ways.  The Blue River is a popular destination for kayakers because of its fluctuating flows and its stunning water. 


Ice caves like this one are caused by natural processes involving glaciers, melting, and sediments.  But knowing the science behind it doesn’t take away from the ice cave’s majesty.  This particular ice cave is located in Skaftafell, Iceland.  It is a temporary structure that is only accessible through a 22-foot entrance along the shoreline. 


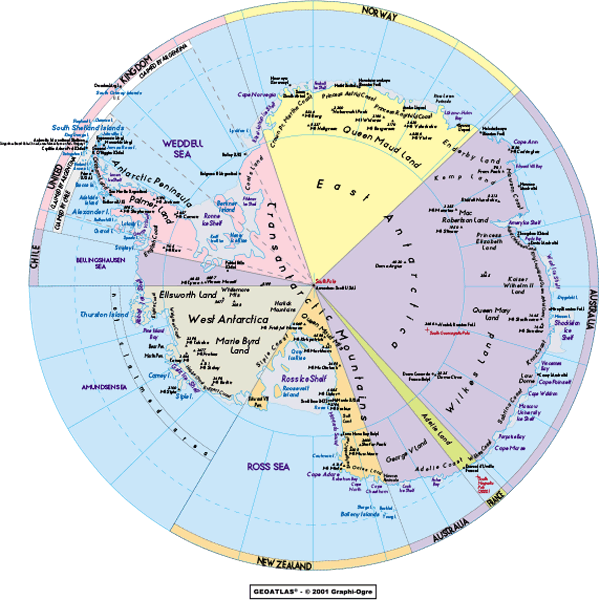
The frozen wave in Antarctica is a structure that needs to be seen to be believed.  Discovered in 2007, it was initially thought that a wave was flash frozen by the sub-zero temperatures and perfectly preserved.  But the presence of blue ice in the wave has led scientists to believe that the structure was actually built slowly over time. 


If you watch movies like Titanic, you may assume that all icebergs are blue or clear.  But sailing around the Southern Ocean will give you different idea.  You will find icebergs with yellow, brown, blue, and green stripes in the cold waters around Antarctica.  This phenomenon occurs when the icebergs interact with salt and fresh waters.  Lapped by the waves, and blown by the winds, icebergs can be painted with amazing stripes of different sizes and textures.


Thanks for reading this article. If you got this far, you probably liked it so please share it with your friends!